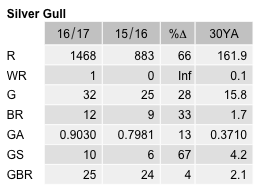
Silver Gull
Chroicocephalus novaehollandiae
ABR description
The following is extracted from the Annual Bird Report for the twelve months to June 2017.
Common, breeding resident
A resident of larger bodies of water in the region.
General: Numbers reported appear to be slowly increasing since the relative stable numbers before 2010-11. Over this period, the abundance has increased from 0.31 in 2009-10 to 3.42 and the reporting rate from 3.1 to 10.5. This year there were slightly fewer records in winter than in the other seasons. Max 800/16 Sep LBG (FuP1), similar to last year. In addition to the records from Spinnaker Island, more than 600 birds were reported from Tuggeranong GrK17 (CaR3) and FSP GrL14 (SmA1). Of the 12 breeding records 8 were dy with the remaining 4 of ne or on/leaving nest at LBath S Morass Gr08, Spinnaker Island LBG GrK14 and Canberra Yacht Club GrK14.
GBS: 104 records from 10 sites, an increase from the 4 sites reported last year. An increase in the average number of birds (22.3 cf 16.6 last year. Max 424/2wk May Fadden (CaR3) of birds flying overhead possibly to roost. 25 breeding records from a single site Yarralumla GrK14 (NeG1) of birds breeding on moored boats.
Abundance
Abundance is the average number of birds of that species per survey. Where the species was observed (presence recorded) but the number of birds seen was not recorded, this is treated as a count of zero.
Abundance by year
This chart shows the abundance of Silver Gull between 1982 and 2017. 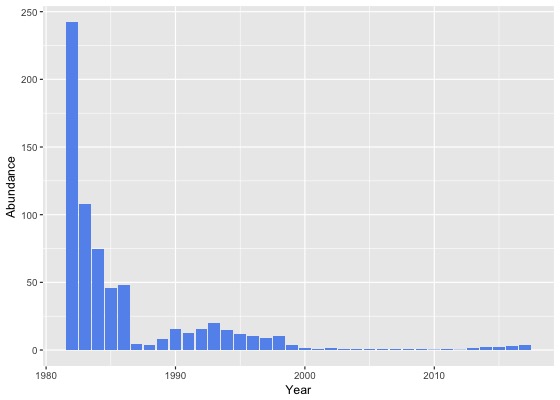
Abundance by month
This chart shows the monthly abundance of Silver Gull. The blue lines show the abundance for the twelve months to June 2017 and the bars show the average abundance for the period 1982 to 2017. 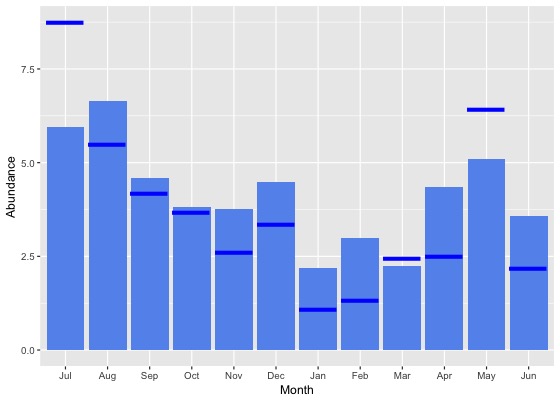
Abundance by season
This chart shows the seasonal abundance of Silver Gull. The blue lines show the seasonal abundance for the twelve months to June 2017 and the bars show the average seasonal abundance for the period 1982 to 2017. 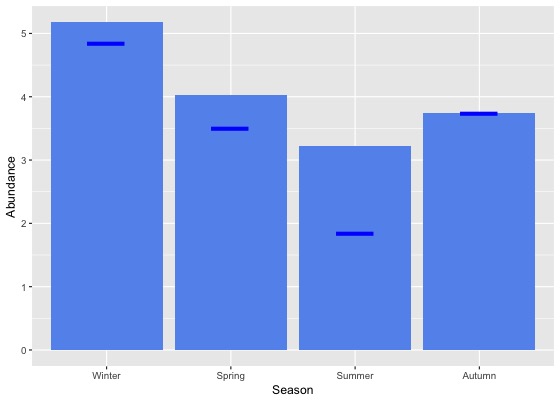
Abundance data
| Month | Season | ||||||||||||||||||
|---|---|---|---|---|---|---|---|---|---|---|---|---|---|---|---|---|---|---|---|
| Period | Jul | Aug | Sep | Oct | Nov | Dec | Jan | Feb | Mar | Apr | May | Jun | Winter | Spring | Summer | Autumn | All | ||
| All years | |||||||||||||||||||
| All | 5.9 | 6.6 | 4.6 | 3.8 | 3.8 | 4.5 | 2.2 | 3.0 | 2.2 | 4.3 | 5.1 | 3.6 | 5.2 | 4.0 | 3.2 | 3.7 | 4.0 | ||
| Previous years | |||||||||||||||||||
| All previous years | 5.5 | 6.9 | 4.6 | 3.8 | 4.0 | 4.7 | 2.4 | 3.3 | 2.2 | 4.6 | 4.8 | 3.8 | 5.2 | 4.1 | 3.5 | 3.7 | 4.1 | ||
| Previous 30 years | 4.3 | 5.8 | 3.6 | 3.0 | 3.4 | 3.3 | 2.2 | 2.2 | 2.1 | 2.6 | 4.2 | 2.0 | 3.8 | 3.3 | 2.6 | 2.8 | 3.1 | ||
| Previous 20 years | 1.5 | 3.5 | 2.5 | 1.8 | 1.9 | 1.8 | 1.4 | 1.4 | 0.9 | 1.1 | 2.7 | 0.9 | 1.8 | 2.0 | 1.5 | 1.4 | 1.7 | ||
| 10 year groups | |||||||||||||||||||
| [2007,2017) | 1.4 | 2.9 | 2.0 | 1.7 | 2.2 | 1.6 | 1.2 | 1.3 | 1.1 | 1.4 | 3.4 | 1.0 | 1.7 | 1.9 | 1.4 | 1.8 | 1.7 | ||
| [1997,2007) | 1.6 | 4.8 | 3.5 | 2.2 | 1.2 | 2.1 | 2.0 | 1.8 | 0.7 | 0.4 | 1.1 | 0.7 | 2.1 | 2.4 | 2.0 | 0.7 | 1.8 | ||
| [1987,1997) | 13.8 | 12.5 | 9.6 | 10.0 | 8.4 | 11.8 | 7.2 | 5.7 | 8.5 | 10.1 | 9.8 | 7.4 | 11.2 | 9.3 | 8.3 | 9.5 | 9.6 | ||
| 5 year groups | |||||||||||||||||||
| [2012,2017) | 1.8 | 3.4 | 2.7 | 2.4 | 2.6 | 2.1 | 1.4 | 1.5 | 1.3 | 1.7 | 4.0 | 1.3 | 2.1 | 2.5 | 1.6 | 2.1 | 2.1 | ||
| [2007,2012) | 0.4 | 1.3 | 0.4 | 0.4 | 1.1 | 0.7 | 0.5 | 0.4 | 0.5 | 0.7 | 1.7 | 0.5 | 0.6 | 0.6 | 0.6 | 0.9 | 0.6 | ||
| [2002,2007) | 0.9 | 2.4 | 0.5 | 1.0 | 0.3 | 0.4 | 1.8 | 1.3 | 0.2 | 0.5 | 1.2 | 0.1 | 0.9 | 0.6 | 1.0 | 0.6 | 0.8 | ||
| [1997,2002) | 2.9 | 7.8 | 7.1 | 4.1 | 2.4 | 4.4 | 2.3 | 2.3 | 1.3 | 0.3 | 0.9 | 1.6 | 3.8 | 4.7 | 3.2 | 0.9 | 3.2 | ||
| [1992,1997) | 24.8 | 18.0 | 10.5 | 15.3 | 14.9 | 23.0 | 14.6 | 8.5 | 14.2 | 8.2 | 9.2 | 7.9 | 16.4 | 13.8 | 15.7 | 10.6 | 14.0 | ||
| [1987,1992) | 8.9 | 9.5 | 9.2 | 7.0 | 5.2 | 6.9 | 3.1 | 4.6 | 5.1 | 11.2 | 10.2 | 7.1 | 8.5 | 7.0 | 4.9 | 8.8 | 7.3 | ||
| Year | |||||||||||||||||||
| 2017 | 8.7 | 5.5 | 4.2 | 3.7 | 2.6 | 3.3 | 1.1 | 1.3 | 2.4 | 2.5 | 6.4 | 2.2 | 4.8 | 3.5 | 1.8 | 3.7 | 3.4 | ||
| 2016 | 1.9 | 5.2 | 2.8 | 3.5 | 4.2 | 4.0 | 1.6 | 1.4 | 1.4 | 2.6 | 6.4 | 1.5 | 3.0 | 3.5 | 2.2 | 3.1 | 2.9 | ||
| 2015 | 2.2 | 4.4 | 5.9 | 3.2 | 2.6 | 1.7 | 0.9 | 0.9 | 0.9 | 0.7 | 3.2 | 1.5 | 2.5 | 3.9 | 1.2 | 1.5 | 2.3 | ||
| 2014 | 2.9 | 0.9 | 1.3 | 2.5 | 2.6 | 1.9 | 1.5 | 2.6 | 1.6 | 2.3 | 2.1 | 1.2 | 1.5 | 2.2 | 1.9 | 2.0 | 1.9 | ||
| 2013 | 2.0 | 1.0 | 0.7 | 0.9 | 1.7 | 1.2 | 3.0 | 1.8 | 1.8 | 1.6 | 2.4 | 0.8 | 1.2 | 1.1 | 2.0 | 1.8 | 1.6 | ||
| 2012 | 0.0 | 0.1 | 0.2 | 0.3 | 0.4 | 0.0 | 0.1 | 0.6 | 0.2 | 0.2 | 0.3 | 0.7 | 0.3 | 0.3 | 0.2 | 0.2 | 0.2 | ||
| 2011 | 1.3 | 0.6 | 0.0 | 0.8 | 2.5 | 1.7 | 0.5 | 0.9 | 0.0 | 0.7 | 3.0 | 0.1 | 0.5 | 0.9 | 1.0 | 1.1 | 0.9 | ||
| 2010 | 0.0 | 0.1 | 0.1 | 0.3 | 0.1 | 0.1 | 0.0 | 0.2 | 0.5 | 1.6 | 0.3 | 0.0 | 0.0 | 0.2 | 0.1 | 0.9 | 0.3 | ||
| 2009 | 0.1 | 3.0 | 0.6 | 0.2 | 0.1 | 0.7 | 1.2 | 0.3 | 0.8 | 0.5 | 0.0 | 0.2 | 0.8 | 0.3 | 0.8 | 0.5 | 0.5 | ||
| 2008 | 0.1 | 2.4 | 0.8 | 0.6 | 3.4 | 0.4 | 0.5 | 0.2 | 0.4 | 0.6 | 2.7 | 0.3 | 0.7 | 1.1 | 0.4 | 0.9 | 0.9 | ||
| 2007 | 0.1 | 0.4 | 0.5 | 0.3 | 0.1 | 0.2 | 0.5 | 0.1 | 1.2 | 0.3 | 0.7 | 1.8 | 1.2 | 0.3 | 0.3 | 0.7 | 0.6 | ||
| 2006 | 0.0 | 0.0 | 0.2 | 0.4 | 0.9 | 0.6 | 3.2 | 1.4 | 0.3 | 0.5 | 0.0 | 0.1 | 0.1 | 0.4 | 1.8 | 0.3 | 0.6 | ||
| 2005 | 2.8 | 1.3 | 0.0 | 0.0 | 0.3 | 1.0 | 0.6 | 0.0 | 0.2 | 0.0 | 1.9 | 0.0 | 1.0 | 0.1 | 0.7 | 0.7 | 0.6 | ||
| 2004 | 0.5 | 0.2 | 0.9 | 0.8 | 0.1 | 0.1 | 1.2 | 5.2 | 0.2 | 0.8 | 0.2 | 0.1 | 0.3 | 0.6 | 1.5 | 0.4 | 0.7 | ||
| 2003 | 2.1 | 1.0 | 0.2 | 0.0 | 0.1 | 0.1 | 1.3 | 0.9 | 0.4 | 1.0 | 3.1 | 0.3 | 1.0 | 0.1 | 0.7 | 1.2 | 0.7 | ||
| 2002 | 0.0 | 9.8 | 1.2 | 3.5 | 0.0 | 0.1 | 2.2 | 0.1 | 0.0 | 0.2 | 0.0 | 0.1 | 2.5 | 1.7 | 0.6 | 0.1 | 1.2 | ||
| 2001 | 1.8 | 0.0 | 1.4 | 1.5 | 0.5 | 0.0 | 0.1 | 0.1 | 0.7 | 0.0 | 0.8 | 0.0 | 0.7 | 1.2 | 0.1 | 0.5 | 0.7 | ||
| 2000 | 0.2 | 0.7 | 0.1 | 0.1 | 3.4 | 2.0 | 2.4 | 1.0 | 1.9 | 0.1 | 0.0 | 0.0 | 0.3 | 1.2 | 1.9 | 0.8 | 1.1 | ||
| 1999 | 9.5 | 14.3 | 10.1 | 0.6 | 0.4 | 7.4 | 1.0 | 0.8 | 1.6 | 0.5 | 0.4 | 4.0 | 7.4 | 3.9 | 3.3 | 0.8 | 3.5 | ||
| 1998 | 0.0 | 43.7 | 23.0 | 16.0 | 6.1 | 7.3 | 1.2 | 2.1 | 1.2 | 0.1 | 7.7 | 4.4 | 16.0 | 15.2 | 4.3 | 2.1 | 10.2 | ||
| 1997 | 8.0 | 4.7 | 15.5 | 17.4 | 2.4 | 15.7 | 14.6 | 17.8 | 1.8 | 1.3 | 0.9 | 0.0 | 4.5 | 10.9 | 16.0 | 1.3 | 8.6 | ||
| 1996 | 3.5 | 35.0 | 4.8 | 2.8 | 15.3 | 10.3 | 11.8 | 3.6 | 9.1 | 9.0 | 1.5 | 14.9 | 19.4 | 7.8 | 8.9 | 7.1 | 10.7 | ||
| 1995 | 25.8 | 16.6 | 2.2 | 9.7 | 8.8 | 12.6 | 9.4 | 0.2 | 28.3 | 5.3 | 14.2 | 6.4 | 16.3 | 7.4 | 8.3 | 15.1 | 11.7 | ||
| 1994 | 35.8 | 24.6 | 18.5 | 17.3 | 25.6 | 13.7 | 9.7 | 3.4 | 8.5 | 13.2 | 5.8 | 2.0 | 18.0 | 21.5 | 8.6 | 9.8 | 14.9 | ||
| 1993 | 16.3 | 5.3 | 0.1 | 42.8 | 3.5 | 100.0 | 51.9 | 44.6 | 12.9 | 2.6 | 3.2 | 2.5 | 7.1 | 17.0 | 67.5 | 6.6 | 20.0 | ||
| 1992 | 43.0 | 1.0 | 26.8 | 16.8 | 14.0 | 7.8 | 3.9 | 10.2 | 10.7 | 7.7 | 19.7 | 15.0 | 21.0 | 19.4 | 7.0 | 13.1 | 15.6 | ||
| 1991 | 7.1 | 8.9 | 16.9 | 3.4 | 11.3 | 18.6 | 17.3 | 17.4 | 11.5 | 15.6 | 33.9 | 2.2 | 6.8 | 10.1 | 17.9 | 20.3 | 12.7 | ||
| 1990 | 17.6 | 8.7 | 13.9 | 20.6 | 15.9 | 20.7 | 5.8 | 10.3 | 5.8 | 41.2 | 17.4 | 9.5 | 12.2 | 16.8 | 12.2 | 21.4 | 15.3 | ||
| 1989 | 1.1 | 10.3 | 10.9 | 5.7 | 9.4 | 3.7 | 1.0 | 4.3 | 12.4 | 11.4 | 20.0 | 10.0 | 7.2 | 8.5 | 3.1 | 14.2 | 8.1 | ||
| 1988 | 6.3 | 1.9 | 10.2 | 5.8 | 1.3 | 3.3 | 1.8 | 2.4 | 0.4 | 5.6 | 1.3 | 4.5 | 4.1 | 5.1 | 2.5 | 2.4 | 3.6 | ||
| 1987 | 98.9 | 148.7 | 2.5 | 5.9 | 1.1 | 4.9 | 1.5 | 2.0 | 1.1 | 4.0 | 2.7 | 7.7 | 21.2 | 3.0 | 2.8 | 2.7 | 4.6 | ||
| 1986 | 116.3 | 29.8 | 68.5 | 77.7 | 5.6 | 75.0 | 15.6 | 28.7 | 11.1 | 29.7 | 10.7 | 120.3 | 84.5 | 49.2 | 42.4 | 19.5 | 48.2 | ||
| 1985 | 47.7 | 78.7 | 29.2 | 28.7 | 23.5 | 37.5 | 66.2 | 76.5 | 41.5 | 94.7 | 65.9 | 93.2 | 72.7 | 27.3 | 48.0 | 72.9 | 45.9 | ||
| 1984 | 250.2 | 82.0 | 278.8 | 243.2 | 293.5 | 228.8 | 18.4 | 47.9 | 1.6 | 64.8 | 17.1 | 71.4 | 91.8 | 261.2 | 65.7 | 30.2 | 74.7 | ||
| 1983 | 89.5 | 79.1 | 302.4 | 83.2 | 99.2 | 92.0 | 8.3 | 121.4 | 81.0 | - | 146.5 | 120.9 | 97.1 | 129.1 | 86.0 | 137.1 | 108.0 | ||
| 1982 | - | 74.5 | - | 0.0 | 55.9 | 130.3 | - | 165.7 | - | 778.9 | - | 170.4 | 128.2 | 49.7 | 145.9 | 778.9 | 242.0 | ||
Reporting rates
Reporting rate is the proportion of all surveys in which the species was present.
Reporting rate by year
This chart shows the reporting rate of Silver Gull each year between 1982 and 2017. 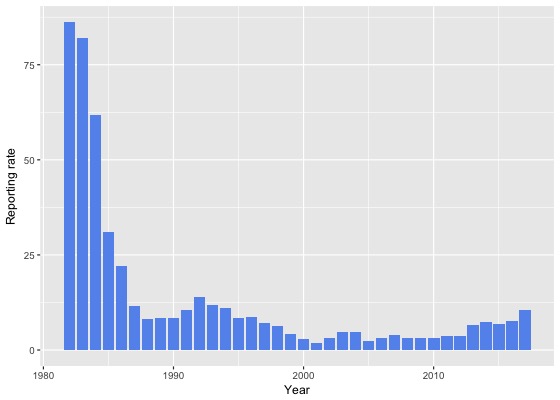
Reporting rate by month
This chart shows the reporting rate by month of Silver Gull. The blue lines show the reporting rate for the twelve months to June 2017 and the bars show the average reporting rate for the period 1982 to 2017. 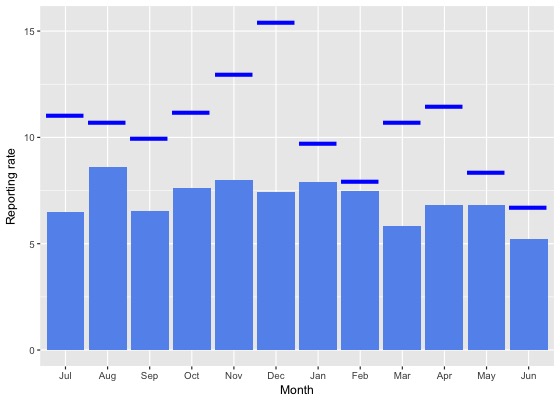
Reporting rate by season
This chart shows the seasonal reporting rate of Silver Gull. The blue lines show the seasonal reporting rate for the twelve months to June 2017 and the bars show the average seasonal reporting rate for the period 1982 to 2017. 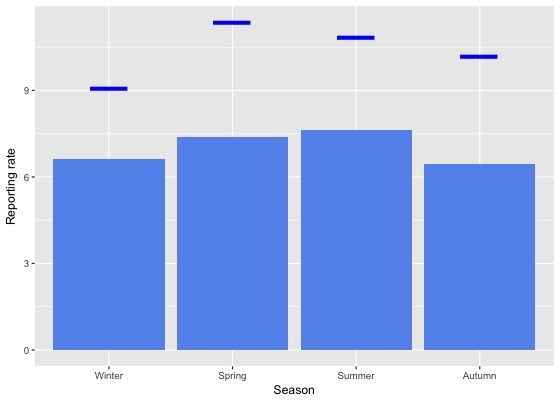
Reporting rate data
| Month | Season | ||||||||||||||||||
|---|---|---|---|---|---|---|---|---|---|---|---|---|---|---|---|---|---|---|---|
| Period | Jul | Aug | Sep | Oct | Nov | Dec | Jan | Feb | Mar | Apr | May | Jun | Winter | Spring | Summer | Autumn | All | ||
| All years | |||||||||||||||||||
| All | 6.5 | 8.6 | 6.5 | 7.6 | 8.0 | 7.4 | 7.9 | 7.5 | 5.8 | 6.8 | 6.8 | 5.2 | 6.6 | 7.4 | 7.6 | 6.4 | 7.1 | ||
| Previous years | |||||||||||||||||||
| All previous years | 5.8 | 8.2 | 6.1 | 7.1 | 7.2 | 6.3 | 7.5 | 7.4 | 5.0 | 6.1 | 6.5 | 4.9 | 6.2 | 6.8 | 7.0 | 5.7 | 6.5 | ||
| Previous 30 years | 5.5 | 7.4 | 5.9 | 6.7 | 6.7 | 5.5 | 7.3 | 6.2 | 4.8 | 5.3 | 6.1 | 4.1 | 5.5 | 6.5 | 6.3 | 5.3 | 5.9 | ||
| Previous 20 years | 4.5 | 6.9 | 5.6 | 6.0 | 6.4 | 4.5 | 6.7 | 5.2 | 3.8 | 4.0 | 5.4 | 2.9 | 4.5 | 6.0 | 5.5 | 4.3 | 5.1 | ||
| 10 year groups | |||||||||||||||||||
| [2007,2017) | 5.4 | 7.9 | 6.5 | 6.2 | 8.0 | 5.2 | 6.6 | 5.6 | 4.6 | 4.7 | 5.9 | 3.2 | 5.1 | 6.7 | 5.9 | 5.0 | 5.8 | ||
| [1997,2007) | 3.1 | 4.9 | 3.7 | 5.2 | 3.3 | 3.1 | 6.7 | 4.3 | 2.1 | 2.3 | 4.1 | 2.3 | 3.2 | 4.1 | 4.5 | 2.6 | 3.6 | ||
| [1987,1997) | 8.8 | 8.6 | 7.3 | 11.0 | 7.6 | 11.0 | 11.3 | 11.0 | 10.2 | 11.8 | 8.8 | 9.9 | 9.1 | 8.8 | 11.1 | 10.3 | 9.7 | ||
| 5 year groups | |||||||||||||||||||
| [2012,2017) | 6.4 | 9.0 | 7.7 | 7.7 | 9.7 | 5.9 | 6.2 | 6.0 | 5.5 | 5.7 | 6.7 | 4.1 | 6.3 | 8.2 | 6.1 | 5.9 | 6.7 | ||
| [2007,2012) | 2.4 | 3.9 | 3.8 | 3.6 | 3.1 | 3.6 | 8.1 | 3.7 | 2.1 | 2.4 | 3.5 | 1.5 | 2.2 | 3.6 | 5.2 | 2.5 | 3.4 | ||
| [2002,2007) | 2.3 | 5.2 | 4.3 | 5.0 | 2.7 | 2.8 | 8.7 | 4.2 | 1.8 | 2.7 | 4.1 | 1.7 | 2.8 | 4.1 | 4.9 | 2.6 | 3.6 | ||
| [1997,2002) | 4.3 | 4.6 | 3.0 | 5.7 | 4.0 | 3.5 | 4.4 | 4.3 | 2.5 | 1.8 | 4.1 | 3.1 | 3.9 | 4.2 | 4.0 | 2.6 | 3.7 | ||
| [1992,1997) | 12.6 | 10.0 | 7.4 | 11.1 | 7.7 | 9.7 | 15.6 | 10.4 | 11.8 | 10.7 | 9.5 | 9.5 | 10.6 | 8.9 | 12.2 | 10.8 | 10.5 | ||
| [1987,1992) | 7.1 | 7.9 | 7.3 | 11.0 | 7.6 | 11.6 | 8.9 | 11.2 | 9.3 | 12.4 | 8.4 | 10.1 | 8.3 | 8.7 | 10.6 | 10.1 | 9.4 | ||
| Year | |||||||||||||||||||
| 2017 | 11.1 | 10.7 | 10.0 | 11.2 | 13.0 | 15.4 | 9.7 | 8.0 | 10.7 | 11.4 | 8.4 | 6.7 | 9.1 | 11.4 | 10.8 | 10.2 | 10.5 | ||
| 2016 | 6.2 | 10.0 | 7.4 | 7.8 | 10.4 | 7.5 | 6.6 | 6.6 | 6.7 | 8.1 | 8.6 | 5.2 | 7.3 | 8.3 | 6.8 | 7.7 | 7.6 | ||
| 2015 | 9.3 | 11.9 | 11.0 | 9.5 | 8.7 | 5.7 | 5.0 | 4.5 | 3.9 | 4.2 | 5.7 | 4.0 | 7.6 | 9.8 | 5.1 | 4.5 | 6.7 | ||
| 2014 | 7.9 | 9.2 | 6.5 | 9.7 | 8.5 | 4.9 | 9.6 | 6.5 | 7.3 | 6.1 | 6.6 | 3.7 | 6.2 | 8.5 | 7.7 | 6.8 | 7.5 | ||
| 2013 | 5.9 | 7.7 | 7.7 | 6.2 | 11.3 | 6.0 | 6.5 | 5.9 | 5.5 | 5.1 | 5.0 | 4.7 | 6.0 | 8.0 | 6.1 | 5.3 | 6.5 | ||
| 2012 | 1.6 | 1.2 | 3.7 | 5.0 | 9.6 | 3.2 | 3.1 | 6.8 | 2.1 | 1.4 | 3.7 | 2.1 | 1.7 | 5.7 | 3.8 | 2.1 | 3.7 | ||
| 2011 | 2.4 | 3.2 | 1.6 | 3.6 | 3.0 | 7.7 | 10.7 | 2.7 | 0.6 | 1.6 | 3.6 | 1.5 | 2.0 | 2.9 | 7.6 | 1.9 | 3.7 | ||
| 2010 | 2.1 | 4.4 | 7.1 | 2.7 | 2.4 | 1.8 | 3.9 | 7.1 | 2.4 | 2.1 | 3.9 | 0.4 | 1.7 | 3.9 | 3.4 | 2.5 | 3.1 | ||
| 2009 | 2.9 | 8.3 | 4.1 | 2.2 | 4.5 | 3.2 | 7.3 | 2.5 | 1.9 | 2.9 | 2.3 | 1.4 | 3.3 | 3.2 | 4.4 | 2.4 | 3.2 | ||
| 2008 | 0.7 | 3.5 | 3.4 | 4.0 | 2.7 | 2.3 | 10.3 | 3.7 | 2.7 | 2.2 | 2.7 | 1.9 | 1.9 | 3.6 | 4.8 | 2.4 | 3.2 | ||
| 2007 | 4.4 | 0.9 | 2.9 | 5.7 | 2.7 | 1.7 | 7.5 | 4.3 | 3.4 | 3.8 | 4.9 | 2.3 | 2.4 | 4.3 | 4.3 | 3.9 | 3.9 | ||
| 2006 | 0.7 | 2.9 | 3.1 | 3.3 | 3.0 | 3.4 | 10.1 | 7.4 | 1.5 | 2.2 | 1.4 | 2.3 | 1.9 | 3.2 | 6.9 | 1.7 | 3.3 | ||
| 2005 | 2.9 | 6.5 | 1.1 | 1.7 | 2.1 | 2.0 | 2.8 | 1.1 | 1.3 | 1.6 | 6.5 | 1.1 | 2.8 | 1.5 | 2.1 | 3.1 | 2.4 | ||
| 2004 | 3.6 | 5.9 | 8.2 | 10.5 | 2.9 | 0.9 | 7.3 | 6.1 | 3.6 | 2.7 | 4.9 | 3.7 | 4.2 | 7.2 | 4.2 | 3.6 | 4.9 | ||
| 2003 | 3.4 | 5.0 | 7.2 | 8.8 | 4.6 | 2.5 | 8.9 | 3.8 | 2.2 | 4.6 | 3.9 | 0.6 | 2.9 | 6.8 | 4.5 | 3.5 | 4.6 | ||
| 2002 | 0.6 | 5.1 | 2.5 | 3.0 | 0.5 | 4.4 | 13.8 | 2.6 | 0.9 | 1.8 | 2.4 | 1.1 | 1.9 | 2.1 | 6.3 | 1.5 | 3.1 | ||
| 2001 | 2.7 | 0.0 | 2.1 | 2.9 | 2.8 | 1.1 | 2.0 | 3.1 | 2.4 | 1.5 | 1.7 | 0.5 | 1.2 | 2.5 | 1.9 | 2.0 | 1.9 | ||
| 2000 | 5.6 | 5.9 | 2.3 | 4.4 | 2.8 | 2.0 | 3.7 | 2.4 | 2.0 | 1.3 | 1.8 | 1.6 | 4.1 | 3.2 | 2.7 | 1.7 | 2.9 | ||
| 1999 | 11.8 | 5.2 | 2.9 | 3.8 | 5.8 | 5.6 | 5.1 | 2.9 | 2.7 | 1.0 | 5.1 | 6.5 | 6.7 | 4.1 | 4.6 | 2.9 | 4.3 | ||
| 1998 | 2.7 | 9.4 | 3.3 | 12.0 | 4.4 | 4.7 | 7.4 | 7.5 | 3.2 | 5.1 | 22.2 | 6.7 | 6.7 | 6.1 | 6.2 | 6.9 | 6.4 | ||
| 1997 | 4.6 | 8.6 | 7.3 | 14.5 | 5.1 | 9.6 | 11.8 | 15.8 | 2.5 | 3.7 | 4.4 | 0.0 | 4.1 | 8.3 | 11.8 | 3.6 | 7.1 | ||
| 1996 | 7.5 | 11.7 | 4.0 | 7.0 | 7.4 | 7.1 | 13.6 | 4.7 | 6.9 | 12.5 | 12.1 | 11.5 | 10.5 | 6.4 | 8.7 | 9.8 | 8.7 | ||
| 1995 | 12.9 | 5.4 | 4.9 | 10.4 | 4.5 | 10.3 | 11.5 | 3.2 | 14.3 | 8.9 | 6.5 | 6.4 | 7.9 | 7.2 | 9.1 | 10.0 | 8.4 | ||
| 1994 | 11.8 | 15.6 | 7.4 | 14.0 | 5.1 | 10.9 | 19.1 | 12.1 | 13.6 | 9.9 | 10.0 | 7.9 | 11.5 | 8.3 | 14.5 | 11.0 | 10.9 | ||
| 1993 | 14.3 | 11.5 | 3.2 | 18.7 | 15.2 | 6.5 | 16.3 | 21.9 | 9.9 | 11.7 | 6.5 | 13.0 | 12.8 | 12.8 | 14.2 | 9.2 | 12.0 | ||
| 1992 | 16.9 | 7.4 | 16.5 | 8.5 | 11.1 | 14.3 | 22.4 | 22.0 | 15.5 | 13.6 | 13.2 | 10.0 | 11.7 | 12.0 | 19.1 | 14.1 | 13.9 | ||
| 1991 | 4.7 | 5.3 | 5.8 | 7.8 | 11.3 | 8.1 | 21.4 | 22.0 | 12.7 | 15.3 | 19.7 | 6.0 | 5.2 | 8.4 | 16.1 | 15.8 | 10.4 | ||
| 1990 | 6.5 | 4.3 | 3.2 | 7.1 | 3.7 | 16.7 | 11.1 | 14.1 | 9.1 | 15.5 | 15.1 | 7.9 | 5.8 | 4.7 | 14.0 | 13.1 | 8.5 | ||
| 1989 | 7.1 | 7.8 | 7.4 | 8.8 | 8.1 | 8.3 | 4.8 | 12.9 | 8.3 | 11.3 | 4.6 | 12.5 | 8.9 | 8.2 | 8.7 | 8.3 | 8.5 | ||
| 1988 | 6.9 | 9.3 | 7.3 | 9.4 | 5.9 | 10.8 | 6.5 | 8.0 | 7.9 | 13.9 | 6.6 | 7.7 | 8.1 | 7.5 | 8.4 | 9.4 | 8.3 | ||
| 1987 | 45.5 | 46.7 | 9.3 | 17.6 | 9.0 | 15.6 | 10.8 | 9.2 | 10.5 | 10.3 | 7.4 | 12.3 | 16.1 | 11.7 | 11.8 | 9.4 | 11.5 | ||
| 1986 | 11.5 | 31.6 | 17.0 | 33.3 | 8.5 | 29.4 | 17.4 | 36.1 | 19.4 | 19.6 | 13.8 | 28.6 | 25.3 | 18.4 | 29.0 | 18.0 | 22.1 | ||
| 1985 | 16.7 | 30.0 | 7.7 | 17.4 | 35.1 | 36.7 | 75.0 | 76.5 | 45.5 | 68.4 | 30.0 | 42.9 | 29.5 | 20.0 | 48.2 | 52.5 | 31.1 | ||
| 1984 | 100.0 | 90.0 | 100.0 | 100.0 | 100.0 | 100.0 | 27.6 | 90.9 | 18.5 | 85.3 | 22.6 | 58.8 | 69.4 | 100.0 | 67.6 | 44.6 | 61.9 | ||
| 1983 | 83.3 | 91.7 | 60.0 | 92.3 | 55.6 | 84.6 | 33.3 | 81.8 | 100.0 | - | 91.7 | 100.0 | 93.1 | 74.1 | 73.3 | 92.9 | 82.0 | ||
| 1982 | - | 81.8 | - | 0.0 | 100.0 | 92.9 | - | 81.8 | - | 84.6 | - | 85.7 | 84.0 | 88.9 | 88.0 | 84.6 | 86.1 | ||
Breeding data
Breeding records by month
Number of breeding records by breeding code and month, 2017 and all years| Breeding code | Jul | Aug | Sep | Oct | Nov | Dec | Jan | Feb | Mar | Apr | May | Jun |
|---|---|---|---|---|---|---|---|---|---|---|---|---|
| 2017 | ||||||||||||
| Breeding (BLA code) | 0 | 0 | 0 | 0 | 0 | 0 | 0 | 0 | 0 | 0 | 0 | 0 |
| Carrying Food | 0 | 0 | 0 | 0 | 0 | 0 | 0 | 0 | 0 | 0 | 0 | 0 |
| Copulating | 0 | 0 | 0 | 0 | 0 | 0 | 0 | 0 | 0 | 0 | 0 | 0 |
| Display | 0 | 0 | 0 | 0 | 0 | 0 | 0 | 0 | 0 | 0 | 0 | 0 |
| Dependent young | 0 | 0 | 1 | 2 | 2 | 3 | 0 | 0 | 0 | 0 | 0 | 0 |
| Faecal sac | 0 | 0 | 0 | 0 | 0 | 0 | 0 | 0 | 0 | 0 | 0 | 0 |
| Inspecting hollow | 0 | 0 | 0 | 0 | 0 | 0 | 0 | 0 | 0 | 0 | 0 | 0 |
| Nest building | 0 | 0 | 0 | 0 | 0 | 0 | 0 | 0 | 0 | 0 | 0 | 0 |
| Nest with eggs | 0 | 0 | 1 | 0 | 0 | 0 | 0 | 0 | 0 | 0 | 0 | 0 |
| Nest with young | 0 | 0 | 0 | 0 | 0 | 0 | 0 | 0 | 0 | 0 | 0 | 0 |
| On/leaving nest | 0 | 1 | 0 | 2 | 0 | 0 | 0 | 0 | 0 | 0 | 0 | 0 |
| All years | ||||||||||||
| Breeding (BLA code) | 0 | 0 | 0 | 0 | 0 | 0 | 0 | 0 | 0 | 0 | 0 | 0 |
| Carrying Food | 0 | 0 | 0 | 0 | 0 | 0 | 0 | 0 | 0 | 0 | 0 | 0 |
| Copulating | 1 | 0 | 0 | 0 | 0 | 0 | 0 | 0 | 0 | 0 | 0 | 0 |
| Display | 0 | 0 | 0 | 0 | 0 | 0 | 0 | 0 | 0 | 0 | 0 | 0 |
| Dependent young | 0 | 0 | 4 | 8 | 4 | 6 | 2 | 0 | 1 | 0 | 0 | 0 |
| Faecal sac | 0 | 0 | 0 | 0 | 0 | 0 | 0 | 0 | 0 | 0 | 0 | 0 |
| Inspecting hollow | 0 | 0 | 0 | 0 | 0 | 0 | 0 | 0 | 0 | 0 | 0 | 0 |
| Nest building | 0 | 2 | 0 | 0 | 0 | 0 | 0 | 0 | 0 | 0 | 0 | 0 |
| Nest with eggs | 0 | 1 | 2 | 2 | 1 | 1 | 0 | 0 | 0 | 0 | 0 | 0 |
| Nest with young | 0 | 0 | 0 | 0 | 2 | 3 | 0 | 0 | 0 | 0 | 0 | 0 |
| On/leaving nest | 1 | 5 | 3 | 10 | 0 | 2 | 1 | 0 | 0 | 0 | 0 | 1 |
Breeding records by year
Average number of breeding records per period by breeding code| Period | Breeding (BLA code) | Carrying Food | Copulating | Display | Dependent young | Faecal sac | Inspecting hollow | Nest building | Nest with eggs | Nest with young | On/leaving nest |
|---|---|---|---|---|---|---|---|---|---|---|---|
| All years | |||||||||||
| All | 0.0 | 0.0 | 0.0 | 0.0 | 0.7 | 0.0 | 0.0 | 0.1 | 0.2 | 0.1 | 0.6 |
| Previous years | |||||||||||
| All previous years | 0.0 | 0.0 | 0.0 | 0.0 | 0.5 | 0.0 | 0.0 | 0.1 | 0.2 | 0.1 | 0.6 |
| Previous 30 years | 0.0 | 0.0 | 0.0 | 0.0 | 0.6 | 0.0 | 0.0 | 0.1 | 0.2 | 0.2 | 0.7 |
| Previous 20 years | 0.0 | 0.0 | 0.0 | 0.0 | 0.8 | 0.0 | 0.0 | 0.1 | 0.2 | 0.2 | 1.0 |
| 10 year groups | |||||||||||
| [2007,2017) | 0.0 | 0.0 | 0.0 | 0.0 | 1.1 | 0.0 | 0.0 | 0.0 | 0.4 | 0.5 | 1.4 |
| [1997,2007) | 0.0 | 0.0 | 0.0 | 0.0 | 0.4 | 0.0 | 0.0 | 0.2 | 0.1 | 0.0 | 0.6 |
| [1987,1997) | 0.0 | 0.0 | 0.1 | 0.0 | 0.2 | 0.0 | 0.0 | 0.0 | 0.1 | 0.0 | 0.0 |
| 5 year groups | |||||||||||
| [2012,2017) | 0.0 | 0.0 | 0.0 | 0.0 | 1.2 | 0.0 | 0.0 | 0.0 | 0.4 | 0.4 | 2.0 |
| [2007,2012) | 0.0 | 0.0 | 0.0 | 0.0 | 1.0 | 0.0 | 0.0 | 0.0 | 0.4 | 0.6 | 0.8 |
| [2002,2007) | 0.0 | 0.0 | 0.0 | 0.0 | 0.6 | 0.0 | 0.0 | 0.4 | 0.2 | 0.0 | 1.0 |
| [1997,2002) | 0.0 | 0.0 | 0.0 | 0.0 | 0.2 | 0.0 | 0.0 | 0.0 | 0.0 | 0.0 | 0.2 |
| [1992,1997) | 0.0 | 0.0 | 0.0 | 0.0 | 0.2 | 0.0 | 0.0 | 0.0 | 0.0 | 0.0 | 0.0 |
| [1987,1992) | 0.0 | 0.0 | 0.2 | 0.0 | 0.2 | 0.0 | 0.0 | 0.0 | 0.2 | 0.0 | 0.0 |
| Year | |||||||||||
| 2017 | 0.0 | 0.0 | 0.0 | 0.0 | 8.0 | 0.0 | 0.0 | 0.0 | 1.0 | 0.0 | 3.0 |
| 2016 | 0.0 | 0.0 | 0.0 | 0.0 | 1.0 | 0.0 | 0.0 | 0.0 | 2.0 | 1.0 | 5.0 |
| 2015 | 0.0 | 0.0 | 0.0 | 0.0 | 0.0 | 0.0 | 0.0 | 0.0 | 0.0 | 1.0 | 0.0 |
| 2014 | 0.0 | 0.0 | 0.0 | 0.0 | 3.0 | 0.0 | 0.0 | 0.0 | 0.0 | 0.0 | 2.0 |
| 2013 | 0.0 | 0.0 | 0.0 | 0.0 | 2.0 | 0.0 | 0.0 | 0.0 | 0.0 | 0.0 | 3.0 |
| 2012 | 0.0 | 0.0 | 0.0 | 0.0 | 0.0 | 0.0 | 0.0 | 0.0 | 0.0 | 0.0 | 0.0 |
| 2011 | 0.0 | 0.0 | 0.0 | 0.0 | 0.0 | 0.0 | 0.0 | 0.0 | 1.0 | 2.0 | 0.0 |
| 2010 | 0.0 | 0.0 | 0.0 | 0.0 | 0.0 | 0.0 | 0.0 | 0.0 | 0.0 | 0.0 | 0.0 |
| 2009 | 0.0 | 0.0 | 0.0 | 0.0 | 0.0 | 0.0 | 0.0 | 0.0 | 1.0 | 1.0 | 0.0 |
| 2008 | 0.0 | 0.0 | 0.0 | 0.0 | 2.0 | 0.0 | 0.0 | 0.0 | 0.0 | 0.0 | 2.0 |
| 2007 | 0.0 | 0.0 | 0.0 | 0.0 | 3.0 | 0.0 | 0.0 | 0.0 | 0.0 | 0.0 | 2.0 |
| 2006 | 0.0 | 0.0 | 0.0 | 0.0 | 1.0 | 0.0 | 0.0 | 0.0 | 0.0 | 0.0 | 2.0 |
| 2005 | 0.0 | 0.0 | 0.0 | 0.0 | 0.0 | 0.0 | 0.0 | 2.0 | 0.0 | 0.0 | 2.0 |
| 2004 | 0.0 | 0.0 | 0.0 | 0.0 | 2.0 | 0.0 | 0.0 | 0.0 | 1.0 | 0.0 | 1.0 |
| 2003 | 0.0 | 0.0 | 0.0 | 0.0 | 0.0 | 0.0 | 0.0 | 0.0 | 0.0 | 0.0 | 0.0 |
| 2002 | 0.0 | 0.0 | 0.0 | 0.0 | 0.0 | 0.0 | 0.0 | 0.0 | 0.0 | 0.0 | 0.0 |
| 2001 | 0.0 | 0.0 | 0.0 | 0.0 | 0.0 | 0.0 | 0.0 | 0.0 | 0.0 | 0.0 | 0.0 |
| 2000 | 0.0 | 0.0 | 0.0 | 0.0 | 0.0 | 0.0 | 0.0 | 0.0 | 0.0 | 0.0 | 1.0 |
| 1999 | 0.0 | 0.0 | 0.0 | 0.0 | 0.0 | 0.0 | 0.0 | 0.0 | 0.0 | 0.0 | 0.0 |
| 1998 | 0.0 | 0.0 | 0.0 | 0.0 | 0.0 | 0.0 | 0.0 | 0.0 | 0.0 | 0.0 | 0.0 |
| 1997 | 0.0 | 0.0 | 0.0 | 0.0 | 1.0 | 0.0 | 0.0 | 0.0 | 0.0 | 0.0 | 0.0 |
| 1996 | 0.0 | 0.0 | 0.0 | 0.0 | 0.0 | 0.0 | 0.0 | 0.0 | 0.0 | 0.0 | 0.0 |
| 1995 | 0.0 | 0.0 | 0.0 | 0.0 | 0.0 | 0.0 | 0.0 | 0.0 | 0.0 | 0.0 | 0.0 |
| 1994 | 0.0 | 0.0 | 0.0 | 0.0 | 0.0 | 0.0 | 0.0 | 0.0 | 0.0 | 0.0 | 0.0 |
| 1993 | 0.0 | 0.0 | 0.0 | 0.0 | 1.0 | 0.0 | 0.0 | 0.0 | 0.0 | 0.0 | 0.0 |
| 1992 | 0.0 | 0.0 | 0.0 | 0.0 | 0.0 | 0.0 | 0.0 | 0.0 | 0.0 | 0.0 | 0.0 |
| 1991 | 0.0 | 0.0 | 0.0 | 0.0 | 0.0 | 0.0 | 0.0 | 0.0 | 1.0 | 0.0 | 0.0 |
| 1990 | 0.0 | 0.0 | 1.0 | 0.0 | 0.0 | 0.0 | 0.0 | 0.0 | 0.0 | 0.0 | 0.0 |
| 1989 | 0.0 | 0.0 | 0.0 | 0.0 | 1.0 | 0.0 | 0.0 | 0.0 | 0.0 | 0.0 | 0.0 |
| 1988 | 0.0 | 0.0 | 0.0 | 0.0 | 0.0 | 0.0 | 0.0 | 0.0 | 0.0 | 0.0 | 0.0 |
| 1987 | 0.0 | 0.0 | 0.0 | 0.0 | 0.0 | 0.0 | 0.0 | 0.0 | 0.0 | 0.0 | 0.0 |
| 1986 | 0.0 | 0.0 | 0.0 | 0.0 | 0.0 | 0.0 | 0.0 | 0.0 | 0.0 | 0.0 | 0.0 |
| 1985 | 0.0 | 0.0 | 0.0 | 0.0 | 0.0 | 0.0 | 0.0 | 0.0 | 0.0 | 0.0 | 0.0 |
| 1984 | 0.0 | 0.0 | 0.0 | 0.0 | 0.0 | 0.0 | 0.0 | 0.0 | 0.0 | 0.0 | 0.0 |
| 1983 | 0.0 | 0.0 | 0.0 | 0.0 | 0.0 | 0.0 | 0.0 | 0.0 | 0.0 | 0.0 | 0.0 |
| 1982 | 0.0 | 0.0 | 0.0 | 0.0 | 0.0 | 0.0 | 0.0 | 0.0 | 0.0 | 0.0 | 0.0 |
Distribution map
Distribution - 2017
This map shows the observed distribution of the Silver Gull for 2017.
The red circles are the grid cells where Silver Gull have been reported.
The transparency of the red circles indicate how many surveys sheets were submitted for that grid cell; the darker the red the more reliable the data. Of the 315 grid cells with reports, 83 had only one sheet; an example is grid number A11.
The size of the circle represents the reporting rate. The maximum reporting rate for Silver Gull was 82.4% (eg grid number Y8) and the minimum was 0.8% (eg grid number J13). 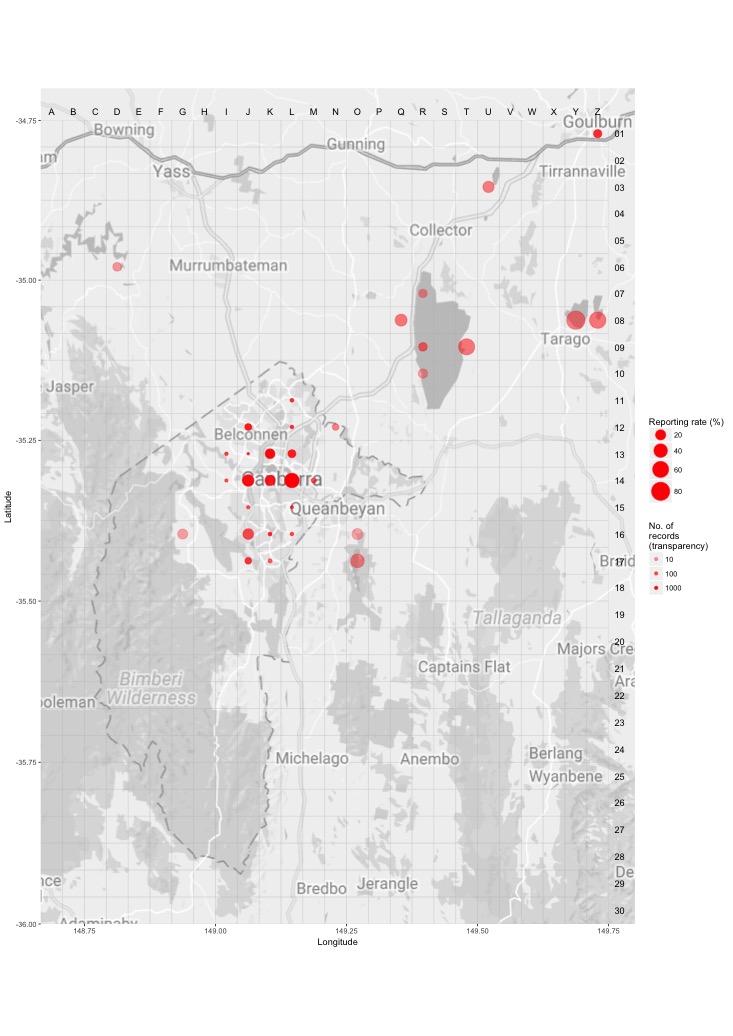
Distribution - all years
This map shows the observed distribution of the Silver Gull for all years.
The red circles are the grid cells where Silver Gull have been reported.
The transparency of the red circles indicate how many surveys sheets were submitted for that grid cell; the darker the red the more reliable the data. Of the 703 grid cells with reports, 55 had only one sheet; an example is grid number A12.
The size of the circle represents the reporting rate. The maximum reporting rate for Silver Gull was 82.1% (eg grid number R6) and the minimum was 0.1% (eg grid number I15). 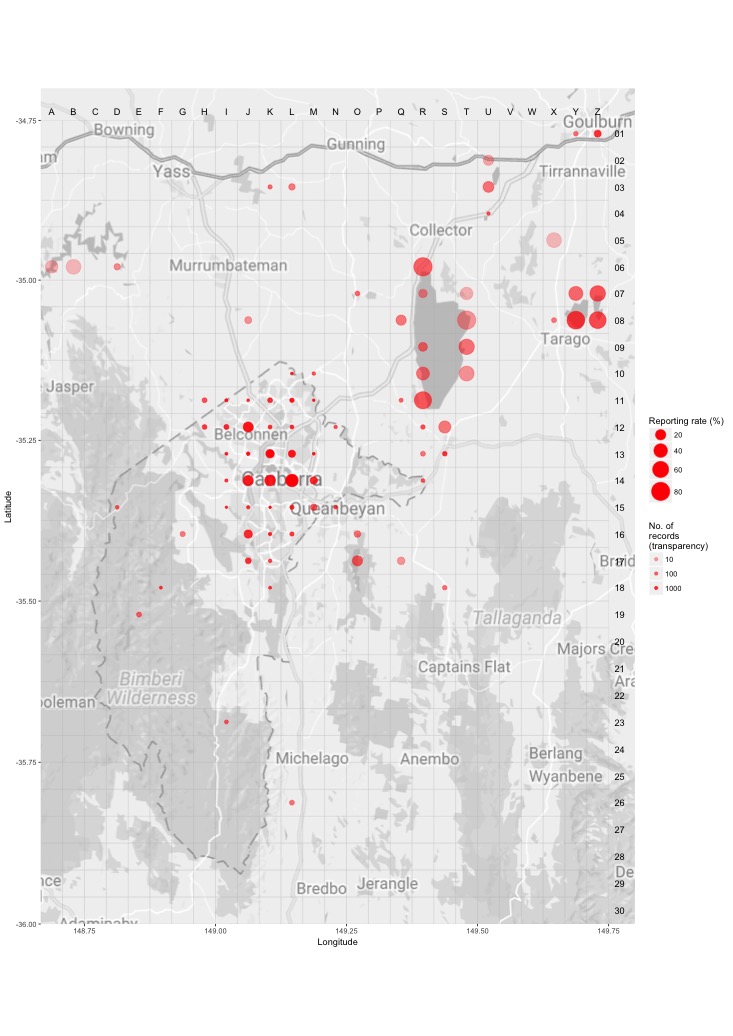
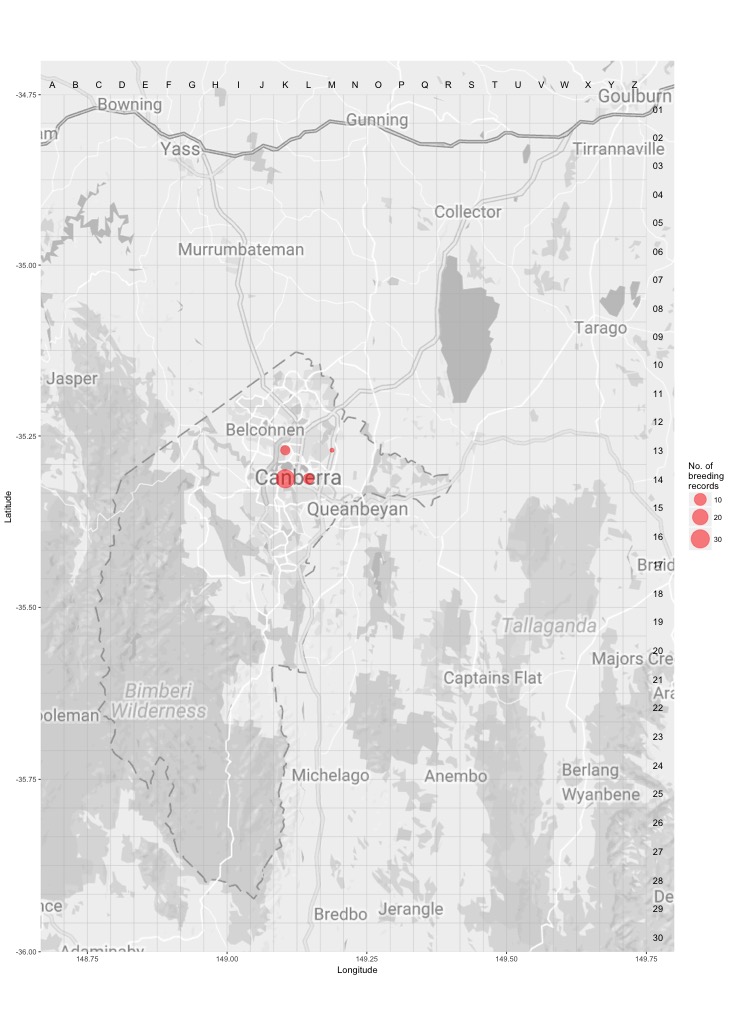
Breeding map
Breeding - 2017
This map shows the breeding distribution of the Silver Gull for 2017.
The red circles are the grid cells where breeding activity for Silver Gull have been reported.
The size of the circle represents the number of reports. 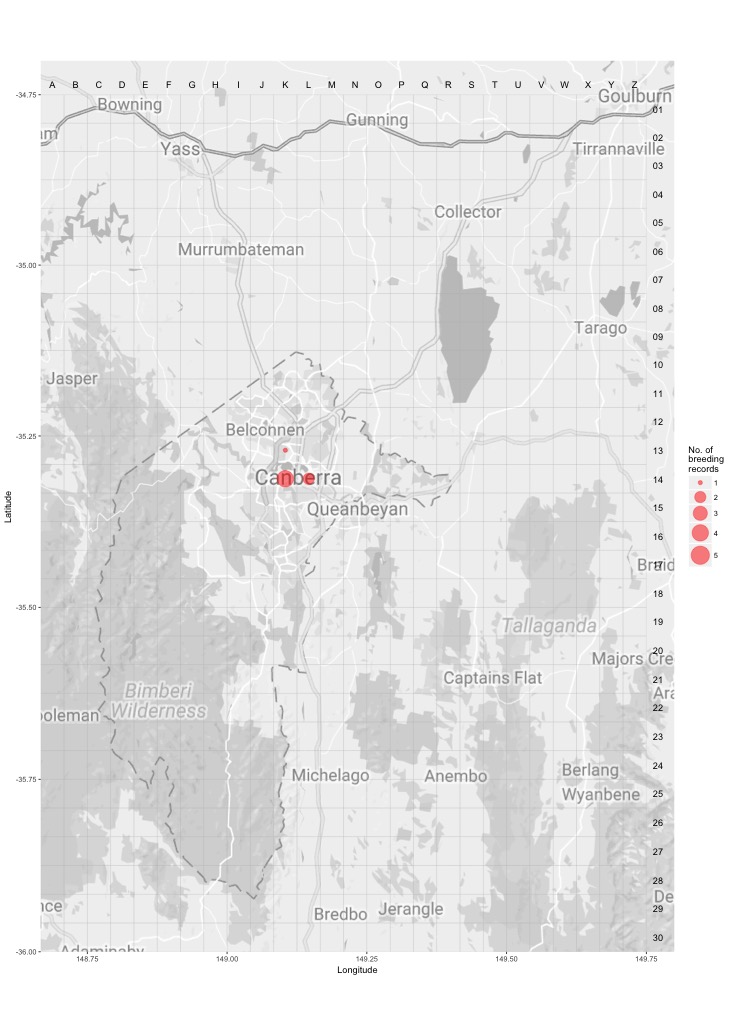
Breeding - all years
This map shows the breeding distribution of the Silver Gull for all years.
The red circles are the grid cells where breeding activity for Silver Gull have been reported.
The size of the circle represents the number of reports.